A modern twist on an old trial:
An experiment on Dice roll probability
Delwar Hussain
Writing for Engineers
10/30/2018
Abstract:
The Dice rolling experiment is a simple way to see and measure probability. With each roll, a different sum is produced. When all the data is gathered, we will be looking for the most probable sum between all the rolls. Using Microsoft Excel, I am able to simulate the Dice rolls by using excels’ rows, column and functions. With each row producing different output of sum and ultimately using excels frequency function I am able to see that the most probable sum of the 100 dice throw is 7. Using the same Excel method, I have done the experiment with 1000 dice roll with the highest sum of being 7 as well.
Introduction:
With any probability experiment, we are dealing with uncertainty and trying to asses’ quantitative data. However, using data analysis, we are able to study and evaluate those uncertainty or measurements. In this experiment, we are rolling or scrolling down a pair of dice and studying each changing outcome and finally measuring a singular frequency for each outcome within expanding field 100 and 1000 rolls.
Hypothesis:
In this experiment, I am trying to see the outcome of dice roll experiment. Given 2 dice rolls with 36 possible combinations (Each die = 6 side, thus 6*6= 36), out of 100 rolls. The probability of seeing sums with higher number would be greater.
Materials
Computer, Microsoft Excel and Microsoft Excel functions(fx).
Methods
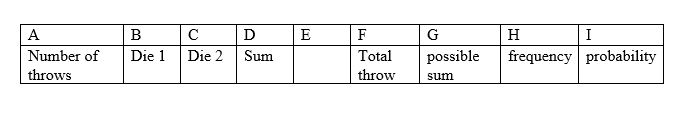
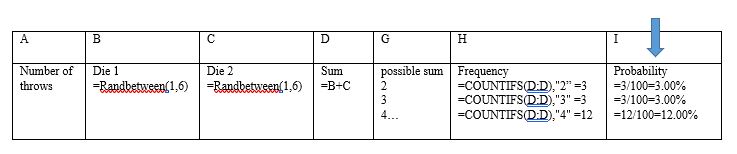
Step 1: Label all the rows according to their perspective functions. Ex. Number of throws, die1, die 2, and sum. Letter A-I representing the column heading in Microsoft excel.
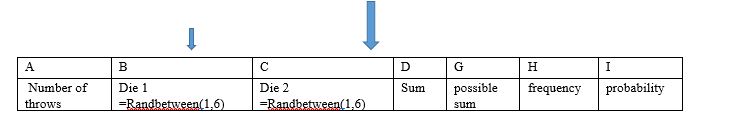
Step 2: Rolling the dice. To simulate a die roll in excel I used =RANDBETWEEN(1,6) function, for both dice. (1,6) to mimic 6 sides of a die.
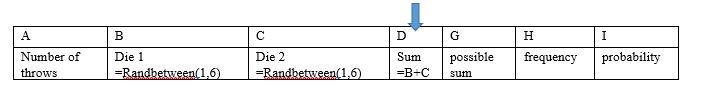
Step 3: Finding the sum. For sum, I used =B3+C3 function. B is die 1 column and C is die 2 column.
Step 4: Select and drag. Using excels select and drag ability I selected the entire row of function starting with number of throws to sum and drag down to 100 from the corner. Thus, mimicking 100 dice throw.

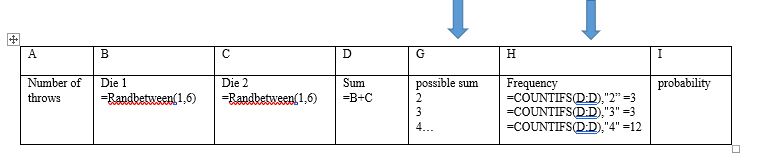
Step 5: Possible sum and frequency. Listing every possible sum, I could receive for each dice throw. Starting with smallest being the 2 (1+1), or the largest 12(6+6). To find the frequency of each sum in my 100 dice throw I first labeled a row frequency than underneath put in the function =COUNTIFS(D:D,”2″). In this equation D:D represent the column D. Because we are looking doe the frequency of a specific number in that column. Column D contains the sum of each throw. To use this function just click on D and it will select the entire column D. With 2 representing the frequency I am looking for. As I continue down 2 is being replace with the next number holding all other aspect of function constant.
Step 6: Looking for probability. Now I was trying to see what the probability of each frequency. For this, I simply take my frequency and divide it by the number of throws.
Step 7: Making a graph. To show my experiment in graph I start with the frequency and sum first. Selecting column G and H than choosing a bar graph from the insert ribbon (The box on top of the worksheet) and excel will put the data into the graph. Using the same method but with column Hand I we can also show a graph on relationship between frequency and probability.
The same methodology was used to create the 1000 dice experiment as well.
Result
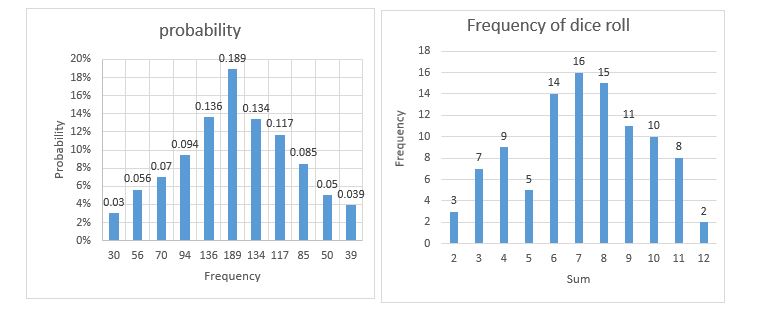
The Result from Experiment A, 100 dice roll.
 The result from Experiment A, 100 rolls
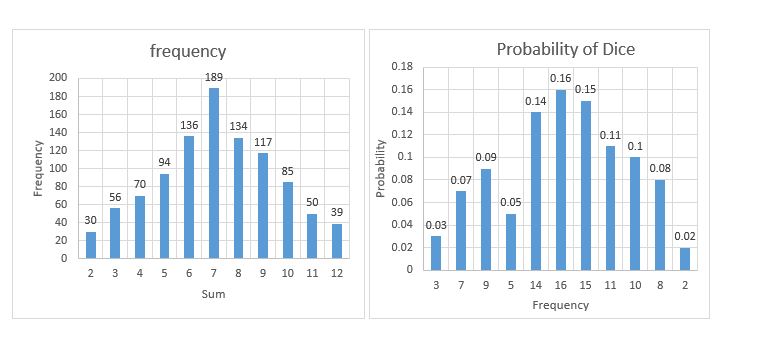
The result from Experiment B, 1000 dice rolls.
Analysis:
The purpose of this lab was to see the probability of dice roll, and my hypothesis was that the highest sum of the dice rolls would be the most frequent. However, as we can see from both experiment, sum with the greatest frequency and the probability is 7, with 6 different combinations between 2 dice. In the first trial with 100 rolls, we see that 7 is highest sum I can get. From the 100 rolls, 7 had a frequency of 16 and out of 100 probabilities of 16%. In the 1000 rolls experiment we have the similar findings. Where 7 was again the highest sum we could receive from those dice rolls. Even with a greater field of experiment sum 7 had a frequency of 189 with a 19% probability. From this 2 graph we can understand that in probability the number with the highest combination can impact the outcome. However, looking at the graph, we can also see that as the field of data expands our frequency and the graph starts to smooth out.
With the 100 experiment even though we have a highest sum the probability and the graph is not consistent. However, looking at the graph for 1000 experiment, we see that frequency and the probability is much smoother. In addition, as the experiment field expanded our sums started to cluster and higher number in the middle became very close.
Conclusion
This experiment was intended to show the probability of dice rolls and throughout this experiment. When studying probability there is never certain answer, but we can make educated assumptions from doing experiments. As we have in this dice roll lab. We can see that in probability even though there is no 1 answer, sum with the greatest combination does play a role.
References
Mishra, Sujay. (2017). What is the most probable sum: A lab report on dice probability. Retrieved from Scribd website: https://www.scribd.com/document/349057903/Lab-Report-Writing-for-Engineers
Sample Lab2. Retrieved from Cabrillo college website: http://www.cabrillo.edu/~jmccullough/physics11/files/sample_lab2.PDF
Appendix 1
We look at our simulated dice roll in Microsoft excel. Using Microsoft Excel Randbetween and countif function we can calculate the frequency and the probability of experiment A and experiment B.

This entry is licensed under a Creative Commons Attribution-NonCommercial-ShareAlike 4.0 International license.